| s |
Sample Standard Deviation |
population samples standard deviation estimator |
s = 2 |
| zx |
Standard Score |
zx = (x-x)
/ sx |
 |
| X ~ |
Distribution of X |
distribution of random variable X |
X ~ N(0,3) |
| N(μ,σ2) |
Normal Distribution |
gaussian distribution |
X ~ N(0,3) |
| U(a,b) |
Uniform Distribution |
equal probability in range a,b |
X ~ U(0,3) |
| exp(λ) |
Exponential Distribution |
f (x) = λe-λx , x≥0 |
 |
| gamma(c, λ) |
Gamma Distribution |
Gamma Distribution |
f (x) = λ c xc-1e-λx/ Γ(c), x≥0 |
| χ 2(k) |
Chi-Square Distribution |
Chi-Square Distribution |
f (x) = xk/2-1e-x/2/ ( 2k/2 Γ(k/2) ) |
| F (k1, k2) |
F Distribution |
F Distribution |
 |
| Bin(n,p) |
Binomial Distribution |
Binomial Distribution |
f (k) = nCkpk(1-p)n-k |
| Poisson(λ) |
Poisson distribution |
Poisson distribution |
f (k) = λke-λ/ k! |
| Geom(p) |
Geometric Distribution |
Geometric Distribution |
f (k) = p(1-p) k |
| HG(N,K,n) |
Hyper-Geometric Distribution |
Hyper-Geometric Distribution |
 |
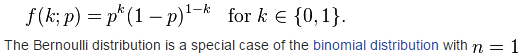
| Bern(p) |
Bernoulli Distribution |
Bernoulli Distribution |
 |
| P(A) |
Probability Function |
probability of event A |
P(A) = 0.5 |
| P(A∩ B) |
Probability of Events Intersection |
probability that of events A and B |
P(A∩B) = 0.5 |
| P(A∪ B) |
Probability of Events Union |
probability that of events A or B |
P(A∪B) = 0.5 |
| P(A |B) |
Conditional Probability Function |
probability of event A given event B occured |
P(A | B) = 0.3 |
| f (x) |
Probability Density Function (PDF) |
Probability Density Function (PDF) |
P(a ≤ x ≤ b)= ∫ f (x) dx |
| F(x) |
Cumulative Distribution Function (CDF) |
Cumulative Distribution Function (CDF) |
F(x) = P(X≤ x) |
| μ |
Population Mean |
mean of population values |
μ= 10 |
| E(X) |
Expectation Value |
expected value of random variable X |
E(X) = 10 |
| E(X |Y) |
Conditional Expectation |
expected value of random variable X given Y |
E(X | Y=2) =5 |
| var(X) |
Variance |
variance of random variable X |
var(X) = 4 |
| σ2 |
Variance |
variance of population values |
σ2 = 4 |
| std(X) |
Standard Deviation |
standard deviation of random variable X |
std(X) = 2 |
| σX |
Standard Deviation |
standard deviation value of random variable X |
σX = 2 |
 |
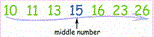
Median |
middle value of random variable x |
 |
| cov(X,Y) |
Covariance |
covariance of random variables X and Y |
cov(X,Y) = 4 |
| corr(X,Y) |
Correlation |
correlation of random variables X and Y |
corr(X,Y) = 0.6 |
| ρX,Y |
Correlation |
correlation of random variables X and Y |
ρX,Y= 0.6 |
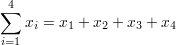
| ∑ |
Summation |
summation - sum of all values in range of series |
 |
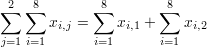
| ∑∑ |
Double Summation |
double summation |
 |
| Mo |
Mode |
value that occurs most frequently in population |
|
| MR |
Mid-Range |
Mid-Range |
MR = (xmax+xmin)/2 |
| Md |
Sample Median |
half the population is below this value |
|
| Q1 |
Lower / First Quartile |
25% of population are below this value |
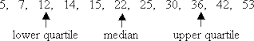 |
| Q2 |
Median / Second Quartile |
50% of population are below this value = median of samples |
|
| Q3 |
Upper / Third Guartile |
75% of population are below this value |
|
| x |
Sample Mean |
average / arithmetic mean |
x =(2+5+9) / 3 = 5.333 |
| s 2 |
Sample Variance |
population samples variance estimator |
s 2 = 4 |


 See Also ►